

- Main Number
(855) 667-3655 - Emergencies
(800) 453-2530 - Crossing gates, signals & rough crossings
(800) 453-2530 - Environmental Spills
(800) 453-2530
Norfolk Southern reports third-quarter 2013 earnings
Oct 23, 2013
NORFOLK, Va., Oct. 23, 2013 /PRNewswire/ --
For 2013 vs. 2012
- Railway operating revenues increased 5 percent to $2.8 billion.
- Income from railway operations was $849 million, up 16 percent.
- Net income increased 20 percent to $482 million.
- Diluted earnings per share were $1.53, up 23 percent.
- The railway operating ratio improved 3 percentage points to 69.9 percent.
Norfolk Southern (NYSE: NSC) reported third-quarter net income of $482 million, 20 percent higher than $402 million for the same period of 2012. Diluted earnings per share were $1.53, up 23 percent compared with $1.24 per diluted share in the third quarter last year.
"Norfolk Southern delivered strong results, led by growth in our chemicals, metals/construction, intermodal, and automotive businesses, combined with ongoing productivity improvements," said CEO Wick Moorman. "Even in the face of continuing weakness in the coal markets, our focus on service efficiency and velocity allowed us to provide superior performance for our customers and excellent results for our shareholders."
Railway operating revenues were $2.8 billion, 5 percent higher compared with third-quarter 2012, with shipment volumes increasing 4 percent.
For the third quarter, general merchandise revenues were $1.6 billion, 11 percent higher compared with the third quarter of 2012, primarily as a result of a 6 percent growth in shipments.
Coal revenues were $641 million, 9 percent lower compared with the third quarter last year, due to lower average revenue per unit and a 2 percent decline in volumes.
Intermodal revenues were $605 million, a 7 percent increase compared with third-quarter 2012. Volumes increased 5 percent due to continued domestic and international growth.
Railway operating expenses for the third quarter totaled $2.0 billion, 1 percent higher compared with the same period of 2012.
Income from railway operations for the third quarter was $849 million, 16 percent higher compared with the same period last year.
The railway operating ratio for the third quarter improved 3 percentage points to 69.9 percent compared with 72.9 percent in the same quarter last year.
Norfolk Southern Corporation is one of the nation's premier transportation companies. Its Norfolk Southern Railway Company subsidiary operates approximately 20,000 route miles in 22 states and the District of Columbia, serves every major container port in the eastern United States, and provides efficient connections to other rail carriers. Norfolk Southern operates the most extensive intermodal network in the East and is a major transporter of coal, automotive, and industrial products.
Norfolk Southern Corporation and Subsidiaries | |||||||||||
Third Quarter | First Nine Months | ||||||||||
2013 | 2012 | 2013 | 2012 | ||||||||
(in millions, except per share amounts) | |||||||||||
Railway operating revenues | |||||||||||
Coal | $ | 641 | $ | 701 | $ | 1,902 | $ | 2,222 | |||
General merchandise | 1,578 | 1,425 | 4,696 | 4,477 | |||||||
Intermodal | 605 | 567 | 1,766 | 1,657 | |||||||
Total railway operating revenues | 2,824 | 2,693 | 8,364 | 8,356 | |||||||
Railway operating expenses | |||||||||||
Compensation and benefits | 735 | 724 | 2,241 | 2,234 | |||||||
Purchased services and rents | 420 | 403 | 1,223 | 1,186 | |||||||
Fuel | 390 | 379 | 1,210 | 1,182 | |||||||
Depreciation | 230 | 230 | 683 | 683 | |||||||
Materials and other | 200 | 226 | 631 | 661 | |||||||
Total railway operating expenses | 1,975 | 1,962 | 5,988 | 5,946 | |||||||
Income from railway operations | 849 | 731 | 2,376 | 2,410 | |||||||
Other income – net (note 1) | 30 | 33 | 194 | 93 | |||||||
Interest expense on debt | 131 | 124 | 388 | 366 | |||||||
Income before income taxes | 748 | 640 | 2,182 | 2,137 | |||||||
Provision for income taxes | |||||||||||
Current | 194 | 97 | 570 | 522 | |||||||
Deferred | 72 | 141 | 215 | 279 | |||||||
Total income taxes | 266 | 238 | 785 | 801 | |||||||
Net income | $ | 482 | $ | 402 | $ | 1,397 | $ | 1,336 | |||
Earnings per share (notes 1 & 2) | |||||||||||
Basic | $ | 1.55 | $ | 1.26 | $ | 4.45 | $ | 4.12 | |||
Diluted | 1.53 | 1.24 | 4.40 | 4.07 | |||||||
Weighted average shares outstanding (note 3) | |||||||||||
Basic | 310.4 | 317.7 | 313.0 | 322.9 | |||||||
Diluted | 313.9 | 321.8 | 316.6 | 327.4 | |||||||
See accompanying notes to consolidated financial statements. | |||||||||||
Norfolk Southern Corporation and Subsidiaries | |||||||||||
Third Quarter | First Nine Months | ||||||||||
2013 | 2012 | 2013 | 2012 | ||||||||
($ in millions) | |||||||||||
Net income | $ | 482 | $ | 402 | $ | 1,397 | $ | 1,336 | |||
Other comprehensive income, before tax: | |||||||||||
Pension and other postretirement benefits | 38 | 33 | 110 | 97 | |||||||
Other comprehensive income (loss) of equity investees | - | - | 2 | (4) | |||||||
Other comprehensive income, before tax | 38 | 33 | 112 | 93 | |||||||
Income tax expense related to items of other | |||||||||||
comprehensive income | (15) | (13) | (43) | (38) | |||||||
Other comprehensive income, net of tax | 23 | 20 | 69 | 55 | |||||||
Total comprehensive income | $ | 505 | $ | 422 | $ | 1,466 | $ | 1,391 | |||
See accompanying notes to consolidated financial statements. | |||||||||||
Norfolk Southern Corporation and Subsidiaries | |||||||
September 30, | December 31, | ||||||
2013 | 2012 | ||||||
($ in millions) | |||||||
Assets | |||||||
Current assets: | |||||||
Cash and cash equivalents | $ | 984 | $ | 653 | |||
Short-term investments | 20 | 15 | |||||
Accounts receivable - net | 1,083 | 1,109 | |||||
Materials and supplies | 224 | 216 | |||||
Deferred income taxes | 149 | 167 | |||||
Other current assets | 34 | 82 | |||||
Total current assets | 2,494 | 2,242 | |||||
Investments | 2,395 | 2,300 | |||||
Properties less accumulated depreciation of $10,271 and | |||||||
$9,922, respectively | 26,413 | 25,736 | |||||
Other assets | 63 | 64 | |||||
Total assets | $ | 31,365 | $ | 30,342 | |||
Liabilities and stockholders' equity | |||||||
Current liabilities: | |||||||
Accounts payable | $ | 1,267 | $ | 1,362 | |||
Short-term debt | - | 200 | |||||
Income and other taxes | 241 | 206 | |||||
Other current liabilities | 377 | 263 | |||||
Current maturities of long-term debt | 447 | 50 | |||||
Total current liabilities | 2,332 | 2,081 | |||||
Long-term debt | 8,499 | 8,432 | |||||
Other liabilities | 2,166 | 2,237 | |||||
Deferred income taxes | 8,074 | 7,832 | |||||
Total liabilities | 21,071 | 20,582 | |||||
Stockholders' equity: | |||||||
Common stock $1.00 per share par value, 1,350,000,000 shares | |||||||
authorized; outstanding 308,910,329 and 314,034,174 shares, | |||||||
respectively, net of treasury shares | 310 | 315 | |||||
Additional paid-in capital | 1,979 | 1,911 | |||||
Accumulated other comprehensive loss | (1,040) | (1,109) | |||||
Retained income | 9,045 | 8,643 | |||||
Total stockholders' equity | 10,294 | 9,760 | |||||
Total liabilities and stockholders' equity | $ | 31,365 | $ | 30,342 | |||
See accompanying notes to consolidated financial statements. | |||||||
Norfolk Southern Corporation and Subsidiaries | |||||
First Nine Months | |||||
2013 | 2012 | ||||
($ in millions) | |||||
Cash flows from operating activities | |||||
Net income | $ | 1,397 | $ | 1,336 | |
Reconciliation of net income to net cash provided by operating activities: | |||||
Depreciation | 687 | 688 | |||
Deferred income taxes | 215 | 279 | |||
Gains and losses on properties and investments (note 1) | (100) | (4) | |||
Changes in assets and liabilities affecting operations: | |||||
Accounts receivable | 26 | (56) | |||
Materials and supplies | (8) | (27) | |||
Other current assets | 48 | 43 | |||
Current liabilities other than debt | 121 | 183 | |||
Other – net | 18 | 34 | |||
Net cash provided by operating activities | 2,404 | 2,476 | |||
Cash flows from investing activities | |||||
Property additions | (1,470) | (1,522) | |||
Property sales and other transactions | 109 | 47 | |||
Investments, including short-term | (29) | (14) | |||
Investment sales and other transactions | 21 | 37 | |||
Net cash used in investing activities | (1,369) | (1,452) | |||
Cash flows from financing activities | |||||
Dividends | (476) | (467) | |||
Common stock issued – net | 92 | 77 | |||
Purchase and retirement of common stock (note 3) | (564) | (1,150) | |||
Proceeds from borrowings – net | 492 | 1,291 | |||
Debt repayments | (248) | (358) | |||
Net cash used in financing activities | (704) | (607) | |||
Net increase in cash and cash equivalents | 331 | 417 | |||
Cash and cash equivalents | |||||
At beginning of period | 653 | 276 | |||
At end of period | $ | 984 | $ | 693 | |
Supplemental disclosures of cash flow information | |||||
Cash paid during the period for: | |||||
Interest (net of amounts capitalized) | $ | 305 | $ | 297 | |
Income taxes (net of refunds) | 485 | 536 | |||
See accompanying notes to consolidated financial statements. | |||||
NOTES TO CONSOLIDATED FINANCIAL STATEMENTS: |
1. Other Income — Net |
2. Earnings Per Share |
3. Stock Repurchase Program |
Connect with NS
http://www.nscorp.com/
http://www.facebook.com/NorfolkSouthern
http://www.flickr.com/photos/norfolksouthern
http://www.twitter.com/nscorp
http://www.youtube.com/user/norfolksoutherncorp
http://www.nscorp.com/nscportal/nscorp/RSS/rss.html
SOURCE Norfolk Southern Corporation
CONTINUE READING
From Atlanta to Antarctica: NS railroader completes marathon on every continent
Jul 31, 2026
When he's not helping ensure the safe and efficient movement of freight across Norfolk Southern's network, General Manager of Operations Neville Wilson can often be found...
Norfolk Southern releases 2026 Forging a Better Tomorrow report
Jul 29, 2026
Norfolk Southern has released its 2026 Forging a Better Tomorrow report, highlighting progress in building a safer, stronger, and more sustainable railroad. Covering perf...
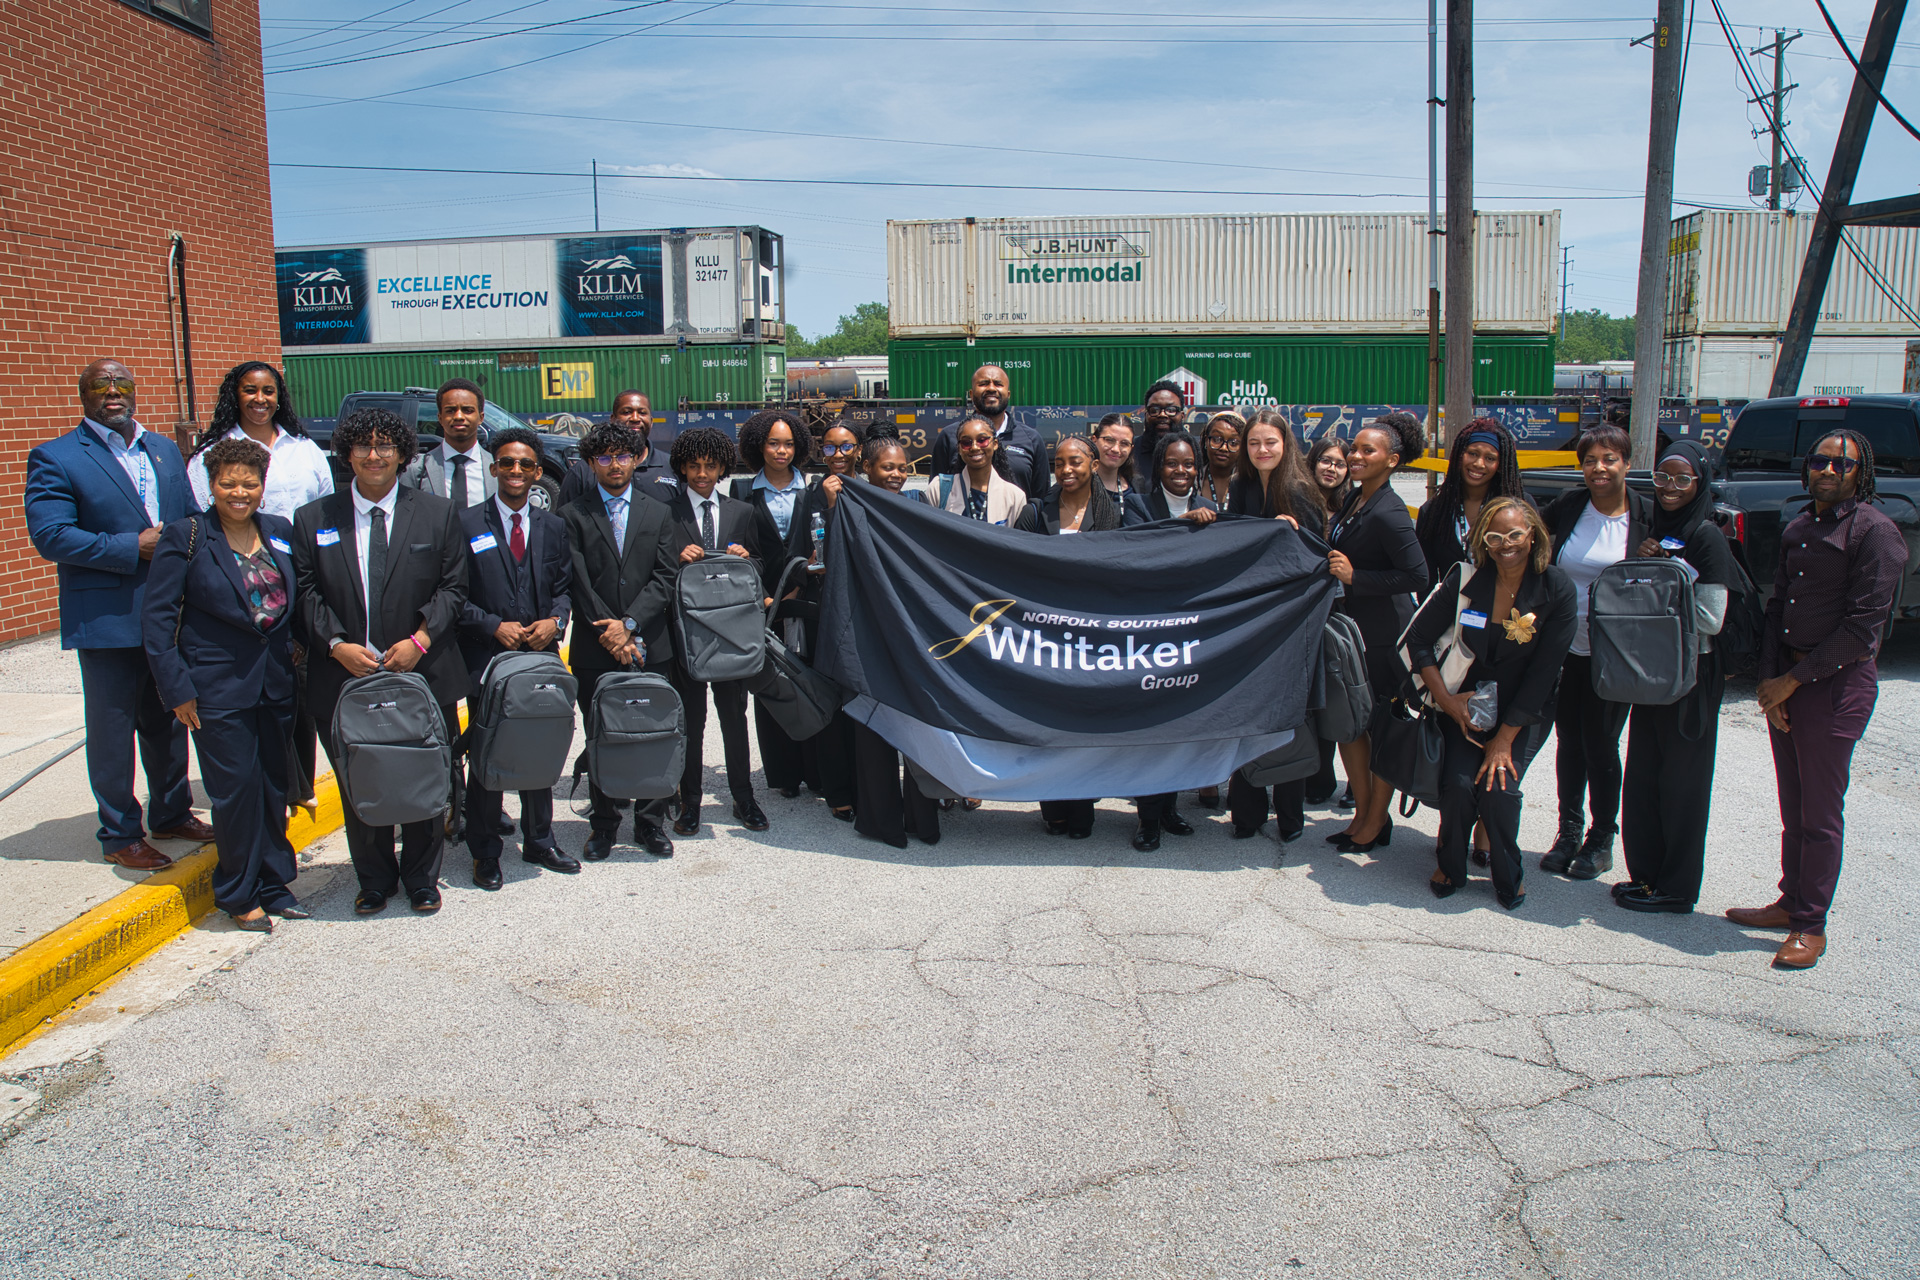
Connecting Chicago's future leaders to careers in rail
Jul 28, 2026
Future leaders recently got a firsthand look at careers in transportation when Norfolk Southern welcomed participants from the Always Giving Back Foundation's 2026 Summer...
Media Contacts
Are you a member of the media? Contact our media relations team.